Leveraging Predictive Analytics to Support Emergency Operations in NYC - Part 2
Written by Jennah Gosciak
New York City Emergency Management (NYCEM) is the primary city agency responsible for coordinating citywide planning and response to major emergencies that impact New Yorkers. These include unexpected incidents, such as major transit strikes or building collapses, as well as more common seasonal ones, like coastal storms and severe winter weather events. While NYCEM uses numerous data-driven tools to prepare for and respond to disasters, the agency is still exploring whether and how predictive tools may support their work.
Prior Work
This project builds on work that I initially started last summer, as a Rubinstein PiTech PhD Impact Fellow. Last summer, I worked with NYCEM’s Office of Strategic Operations (OSO) to explore how machine learning methods might support preparedness and response efforts in the agency. The project involved several parts:
Understanding how NYCEM makes decisions and identifying problem-areas where predictions may have the greatest impact.
Studying the different agency-developed tools involved in decision-making – indices such as the Heat Vulnerability Index, the Flood Vulnerability Index, or the Urban Risk Index – and conducting sensitivity analyses.
Identifying hazards that might be well-suited to a prediction-based framework and prototyping a solution.
After considering a number of hazards, we decided to scope the project to focus on extreme heat, which is a consistent and growing problem in New York City but also understudied in the literature. Extreme heat emergencies lead to an estimated 500+ deaths each summer. NYCEM prepares for and responds to extreme heat during peak periods by sending out alerts (e.g., the Beat the Heat campaign) via the City’s emergency public messaging program, NotifyNYC, and activating cooling centers.
The primary tool available to practitioners for heat-related decision-making is the Heat Vulnerability Index (HVI). However, the HVI is a static index that may be only weakly related to the competing priorities of different NYCEM teams. For example, heat emergencies may involve concerns about increased power outage risk or heat-related emergency calls.
To complement existing tools like the NYC HVI, I proposed developing simple machine learning models that predict the impacts of extreme heat: (1) hydrant-related 311 complaints, (2) power outages, and (3) heat-related emergency calls. The predictions from these models can be used to inform decision-making for time-sensitive, discrete tasks where one or several of these outcomes may be relevant.
By the end of the summer, I had scoped the project and concretized the problem. I also identified and cleaned relevant data inputs and developed a prototype tool using historical data. Given this opportunity to continue this work – first as a college aide with NYCEM and then as a PiTech Rubinstein Innovation Fellow – my goal for the academic year has been to further advance the project: produce viable predictions for three heat-related impacts, evaluate the quality of the predictions across several different spatiotemporal modeling approaches, and incorporate these predictions back into the prototype tool (developed initially at the end of the summer).
Obtaining Stakeholder Input
In collaboration with OSO, we solicited stakeholder input throughout this process. Specifically, we sought feedback from NYCEM’s Public Warning Unit, Community Engagement Bureau, and External Affairs Bureau. We presented to representatives from these teams once in the fall and spring. The goal of our first meeting was to determine if the selected heat-related impacts might be useful for some decision-making. In the second meeting, in the spring, we presented preliminary results and potential trade-offs resulting from the choice of evaluation metrics. The input from representatives on these teams has been useful for either validating or changing key design decisions throughout this process. In addition to these teams, I also presented this work to several members from NYCEM’s GIS team, and I aim to integrate this tool with the GIS team’s existing data infrastructure.
Technical Approach
I predict heat-related impacts based on several kinds of input data: temperature and humidity information from National Weather Service and local weather stations in NYC, sociodemographic characteristics obtained from the U.S. Census, and other static information like land use (available from the Department of City Planning) and land surface temperature (available from NASA).
I then tested the performance of several machine learning models at varying spatial and temporal scales and for both classification and regression tasks. The models I evaluated include simple linear regression approaches as well as more complex gradient boosting methods. Future work could explore whether there are any substantial performance gains with different models (such as, graph-based spatial models).
To examine whether varying time is consequential, I compared model performance for generating both daily and weekly predictions. To assess the effect of spatial resolution, I compared predictions from a citywide model with no spatial information to spatial models that make predictions for more granular geographies like census tracts and zipcodes.
Results
In general, the choice of evaluation metric, spatial resolution, and temporal scale all affect model performance. Models for hydrant-related 311 complaints and heat-related emergency calls performed modestly. While the predictive models improve over baseline approaches (e.g., using the historical cumulative average of the outcome), the predictions do make substantial errors. The sparse and skewed nature of the outcomes in these models led us to select models that focus on binary prediction and make weekly predictions.
Predictive models for power outages tended to perform well. For power outages, there was often substantial variation in the power outage rate, which led us to focus on regression models that predict the power outage rate, as opposed to a binary classification task.
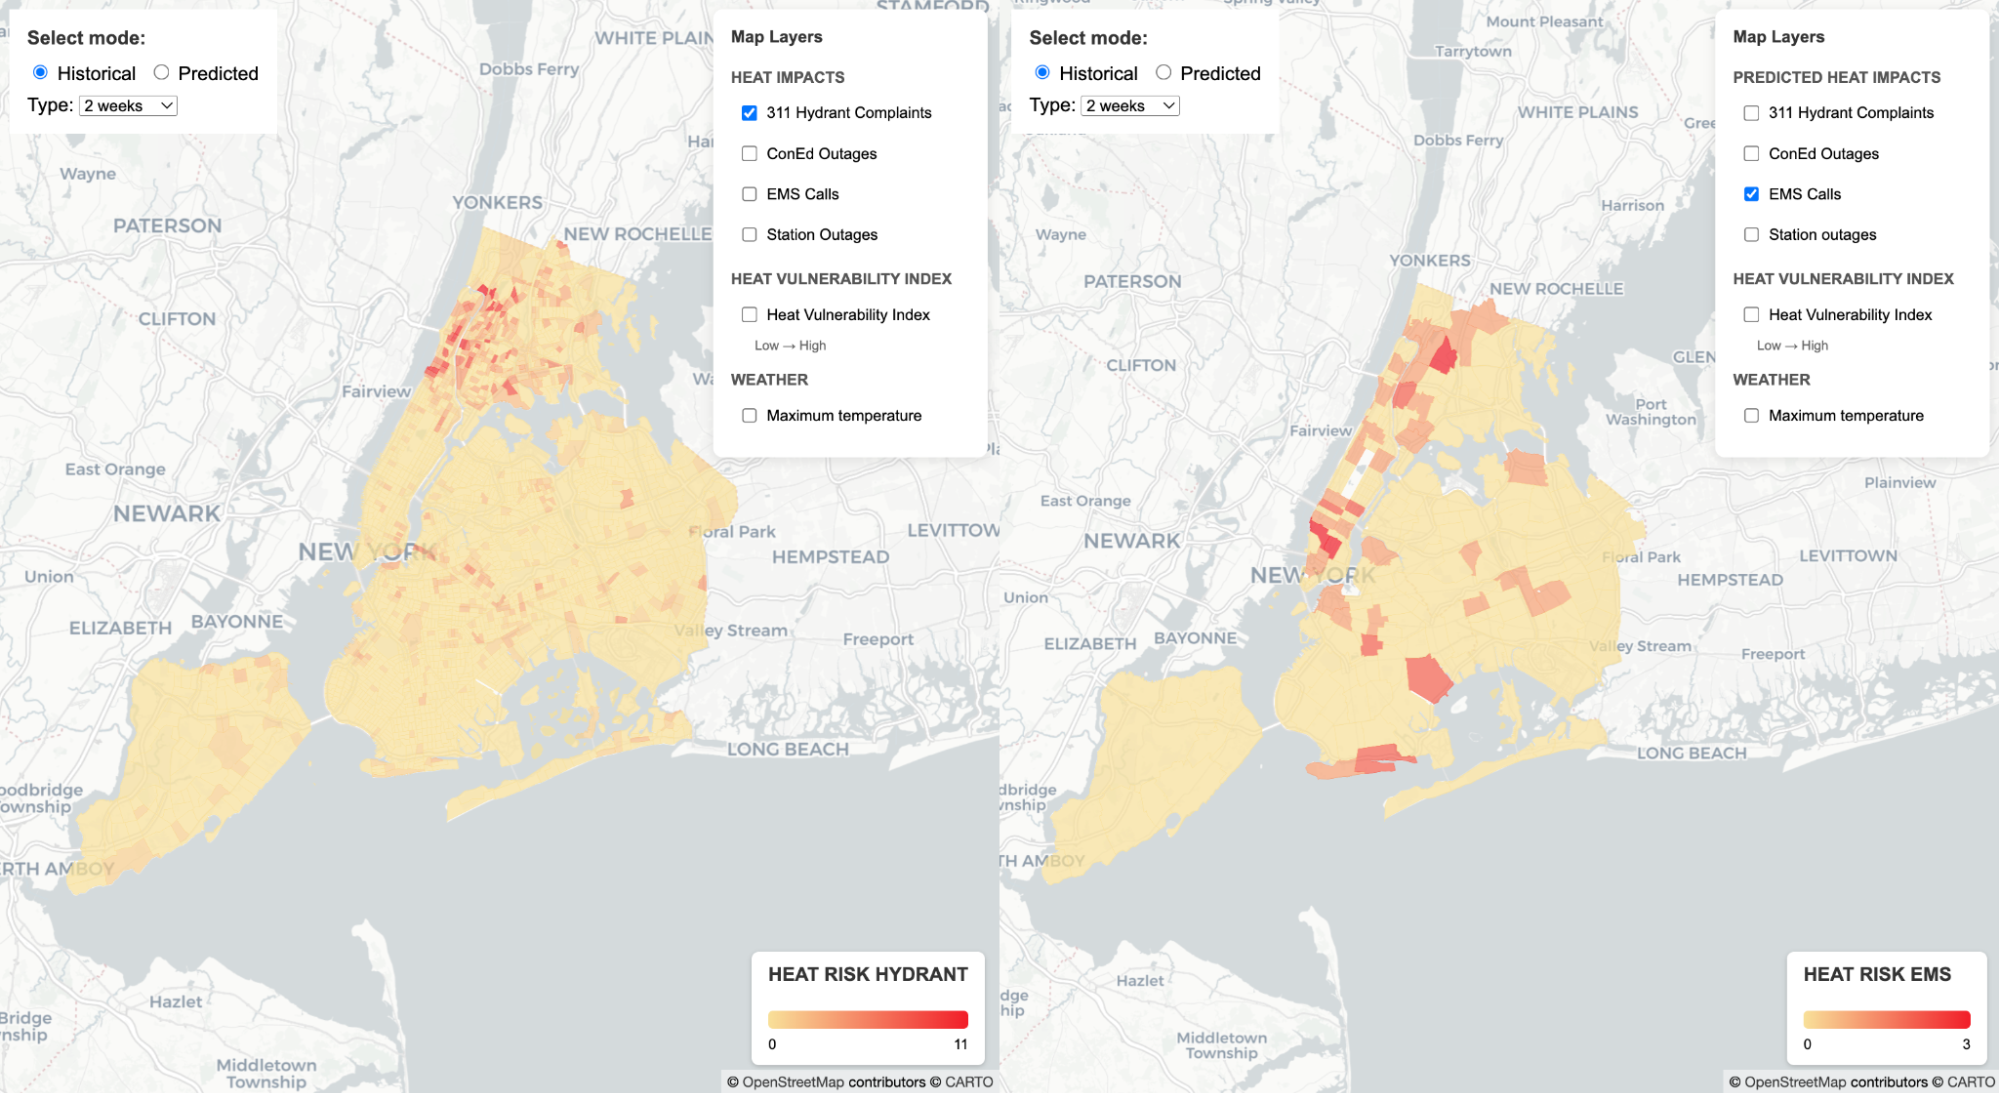
Figure 1. The most recent version of the prototype tool that can visualize both predicted heat risk scores obtained from a predictive model, historical data, and static information like land surface temperature and the NYC Heat Vulnerability Index.
Impact and Path Forward

Jennah Gosciak
Ph.D. Student, Information Science, Cornell University
After evaluating different machine learning models, I then revised the prototype tool to incorporate both historical and predicted information (see Figure 1). This tool is speculative in nature, and illustrates with real data how NYCEM might incorporate predictions into an interactive map or similar data tool. A key decision in the design of the tool is to present two independent and adjacent interactive maps, which enables potential users to compare across both historical and predicted data, and to compare predicted data to existing tools like the Heat Vulnerability Index. My hope is that this prototype tool can serve as the blueprint for future work and inform heat-related decision-making at the agency as heat season gets underway.
To learn more about Jennah’s earlier work with NYC Emergency Management (NYCEM) during her Siegel PiTech PhD Impact Fellowship, read her previous blog post here.