Designing an Analytical Workspace for Behavioral Intervention Plan Evaluation

Written by Yuanchen Bai (Sophie)
As a PiTech Rubinstein PhD Innovation Fellow, I’ve been working over the past few months on a project centered on AI usage in behavioral intervention work: “How can we support Behavioral Intervention Specialists (BISs) in making sense of diverse, complex behavioral data when evaluating support plans for individuals with Intellectual/Developmental Disability (I/DD)?”
Behavioral data is never just data, but represents moments, contexts, and lived experiences. BISs read these patterns not simply to monitor progress, but to understand the individual behind them: what has changed, what might be emerging, and how an intervention is shaping daily life. Yet much of this information is fragmented across formats and time, making it challenging to hold the whole picture in view.
Building on exploratory work I conducted over the summer as a PiTech PhD Impact Fellow, I spent the fall conducting additional interviews with BISs and identified needs that shaped the design of an analytical tool that could fit into existing workflows. From this foundation came the prototype I’m sharing here: an interface with four main parts.
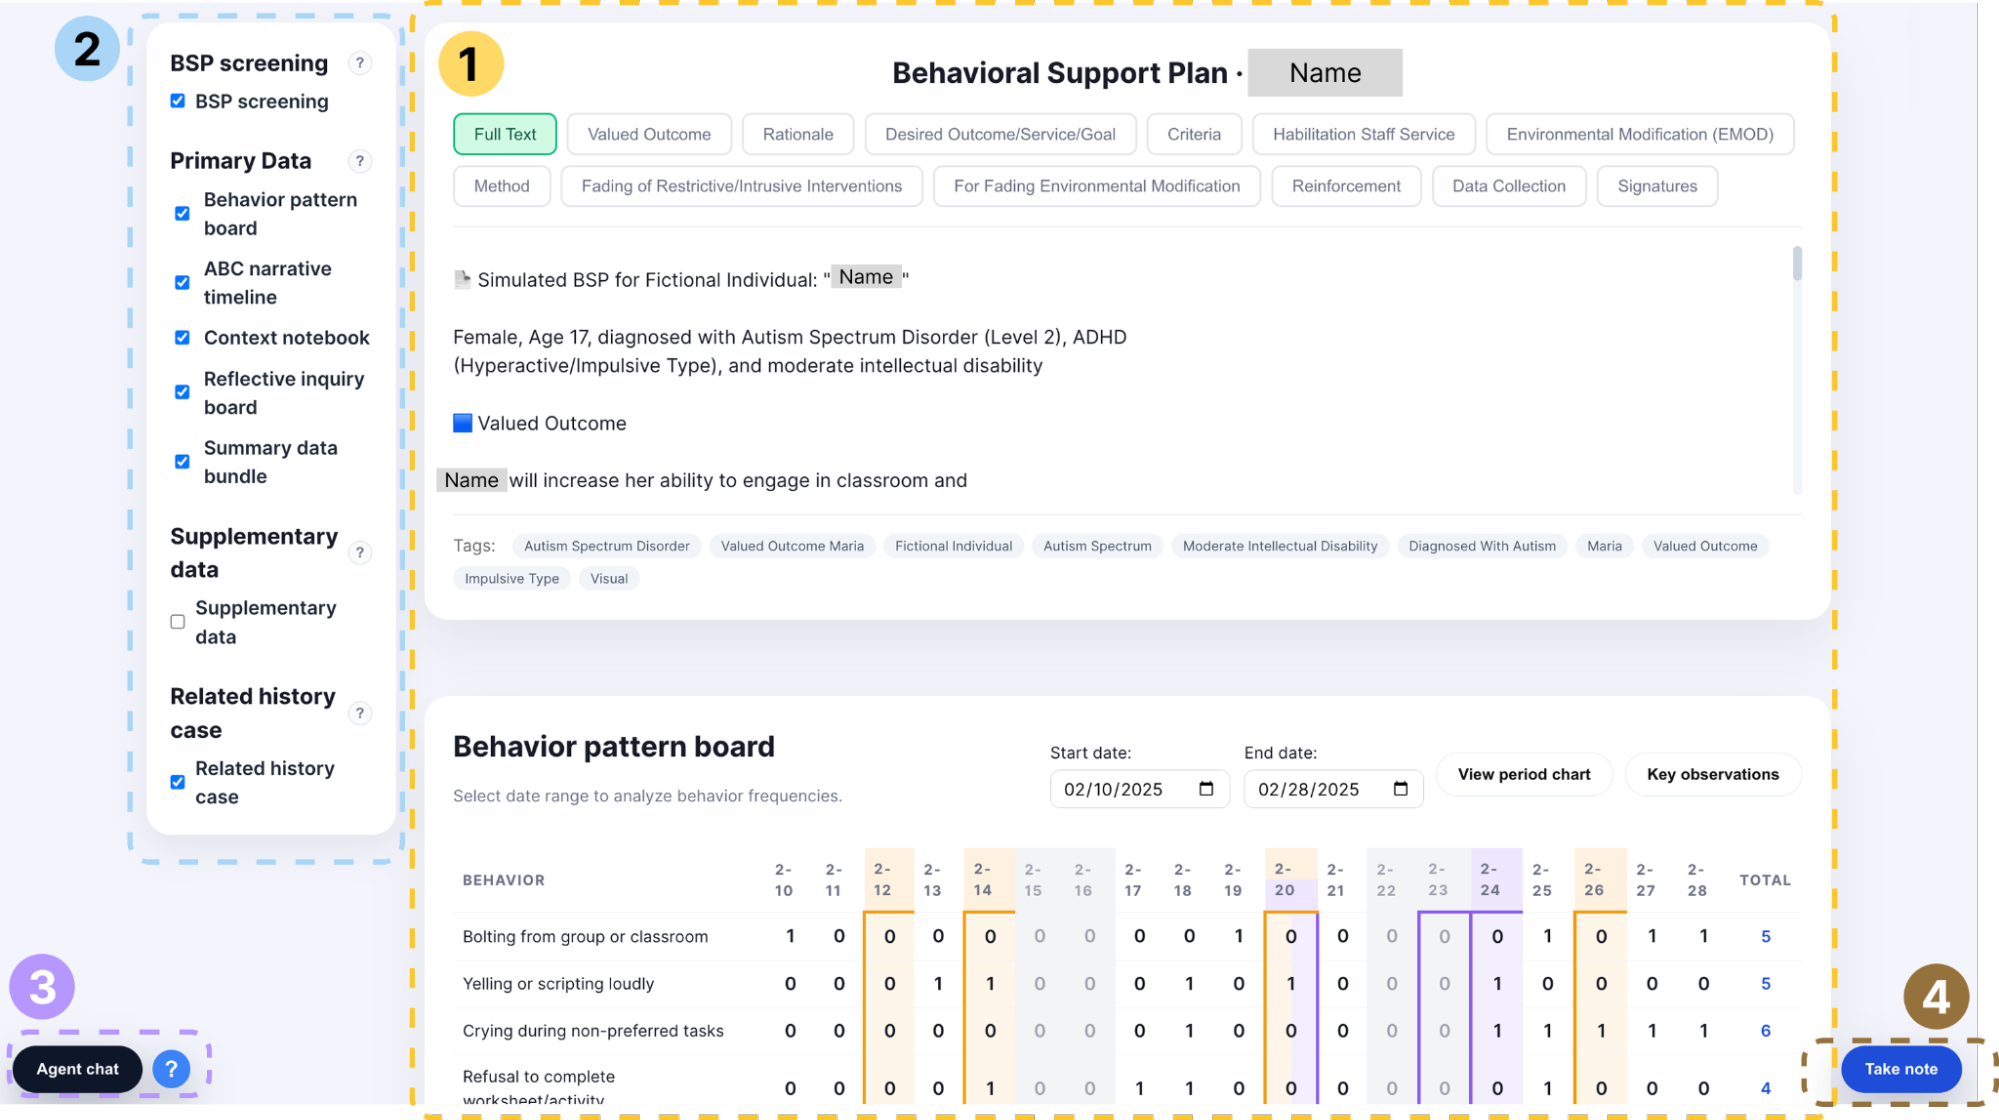
Figure 1: Prototype of an Analytical Tool for Behavioral Support Planning
1) Data Workspace: Bringing Behavioral Information Into a Coherent Analytical Frame
Instead of treating datasets as separate artifacts, the workspace brings together behavioral frequencies, contextual notes, ABC (Antecedent-Behavior-Consequence data) narratives, and previous BSPs (Behavior Support Plan) so they can be interpreted in relation to one another.
The BSP is always one click away, making it easy to revisit earlier goals or strategies during evaluation. The behavior pattern board visualizes day-to-day frequencies and highlights key moments: orange for ABC narrative events, purple for contextual changes, and gray for days without data. Practitioners can zoom in on specific periods or zoom out to observe longer-term trends. A period chart offers an aggregated view, while AI-generated Key Observations summarize notable shifts, correlations, or patterns worth further attention.
In addition, keyword-derived tags allow cases with similar themes to surface one another, supporting cross-case insight when helpful. Ongoing contextual notes accumulate the environmental details (e.g., risk factors, protective factors, day-to-day variations) that may shape behavior in ways raw counts cannot capture. A reflective inquiry space gives BISs room to document questions, hypotheses, or data-accuracy checks that may require follow-up with colleagues. And when a high-level overview is needed, a summary bundle consolidates key indicators into a concise snapshot.
Individually, each component serves a specific analytical purpose. Collectively, they support a mode of review that more closely reflects how practitioners naturally reason: moving between patterns and narratives, connecting observations with context, and continuously situating quantitative signals within the lived experience of the individual they are supporting.
2) Data Selection Panel: Structuring Attention Without Interrupting Workflow
Right beside the workspace is a small panel that quietly plays an important role: it lets practitioners decide what they want to focus on. BISs sometimes need to shift between comparing a pattern, revisiting a narrative, or stepping back to see broader trends. Instead of relying on a fixed layout, the selection panel lets them bring certain components forward and temporarily set others aside.
It gives BISs control over what enters their field of view—reducing noise, highlighting what matters in the moment, and making meaningful comparisons easier to see.
3) Agent Chat: Thinking Through Patterns With a Digital Colleague
Often, the real challenge isn’t finding the data—it’s figuring out what the data points toward. The Agent Chat was designed with this interpretive step in mind. Practitioners can explore why a spike might have occurred, consider how two behaviors relate, or ask whether context recorded elsewhere might explain a shift.
Behind the scenes, multiple agents retrieve and connect information, but from the practitioner’s perspective, it feels more like talking through possibilities with a colleague who remembers the details. The goal is not to deliver final answers, but to support the interpretive process.
4) Take Notes: Capturing Insights Along the Way
During evaluation, thoughts can arise at different moments along the way.Sometimes a connection appears while looking at the pattern board; other times a question comes up while reading a narrative. The Take Notes panel offers a place to hold these ideas without interrupting the review.
BISs can record hypotheses, reminders, follow-up questions, or contextual thoughts, and they can return later to see where they left off or revise earlier notes as their understanding evolves. Notes can also be exported or shared when needed, making it easier to carry insights into team discussions and future sessions.
Reflections on Designing for Behavioral Support
This project highlighted a tension in designing analytical tools for behavioral support: data can reveal important patterns, but it can never fully represent the lived experience of individuals with I/DD. Even as AI becomes increasingly capable of analyzing complex behavioral signals, its insights remain limited by what the underlying data can express. Many aspects of behavior—its meaning, its context, its emotional texture—exist beyond what quantitative records can capture.

Yuanchen Bai (Sophie)
Ph.D. Student, Information Science, Cornell University
For this reason, the role of AI in such systems is not to replace interpretation, but to support it. AI can help organize information, surface potential connections, and reduce the cognitive effort required to navigate complex datasets. Yet the final understanding still depends on BISs’ contextual knowledge, professional judgment, and their familiarity with the individual.
Designing tools for this domain, therefore, requires thinking beyond “adding AI” and instead considering how AI, data, and human reasoning can be integrated into a coherent workflow. The challenge is to build systems that acknowledge the limits of data, leverage AI where it is genuinely helpful, and leave space for the aspects of understanding that remain essentially human.