Understanding How New Yorkers Really Feel About City Services through 311 Satisfaction Data
Written by Sanghee Kim

Overview
How do New Yorkers feel about the services that city agencies provide in response to their 311 requests? To help answer this question, as a Siegel PiTech PhD Impact Fellow, I collaborated with the New York City Office of Technology and Innovation’s Office of Data Analytics to analyze data from the 311 Resolution Satisfaction Survey. We developed a unified framework that allows city agencies to measure and understand changes in customer satisfaction over time. This effort marks an important step toward improving how government agencies listen to and serve their residents.
Our analysis focused on how 311 service request satisfaction trends evolved for three of the City’s largest agencies: the Department of Sanitation (DSNY), the Department of Housing Preservation and Development (HPD), and the New York Police Department (NYPD). The findings provide valuable insights into how New Yorkers experience government services, what drives dissatisfaction, and how feedback can guide more responsive public policy.
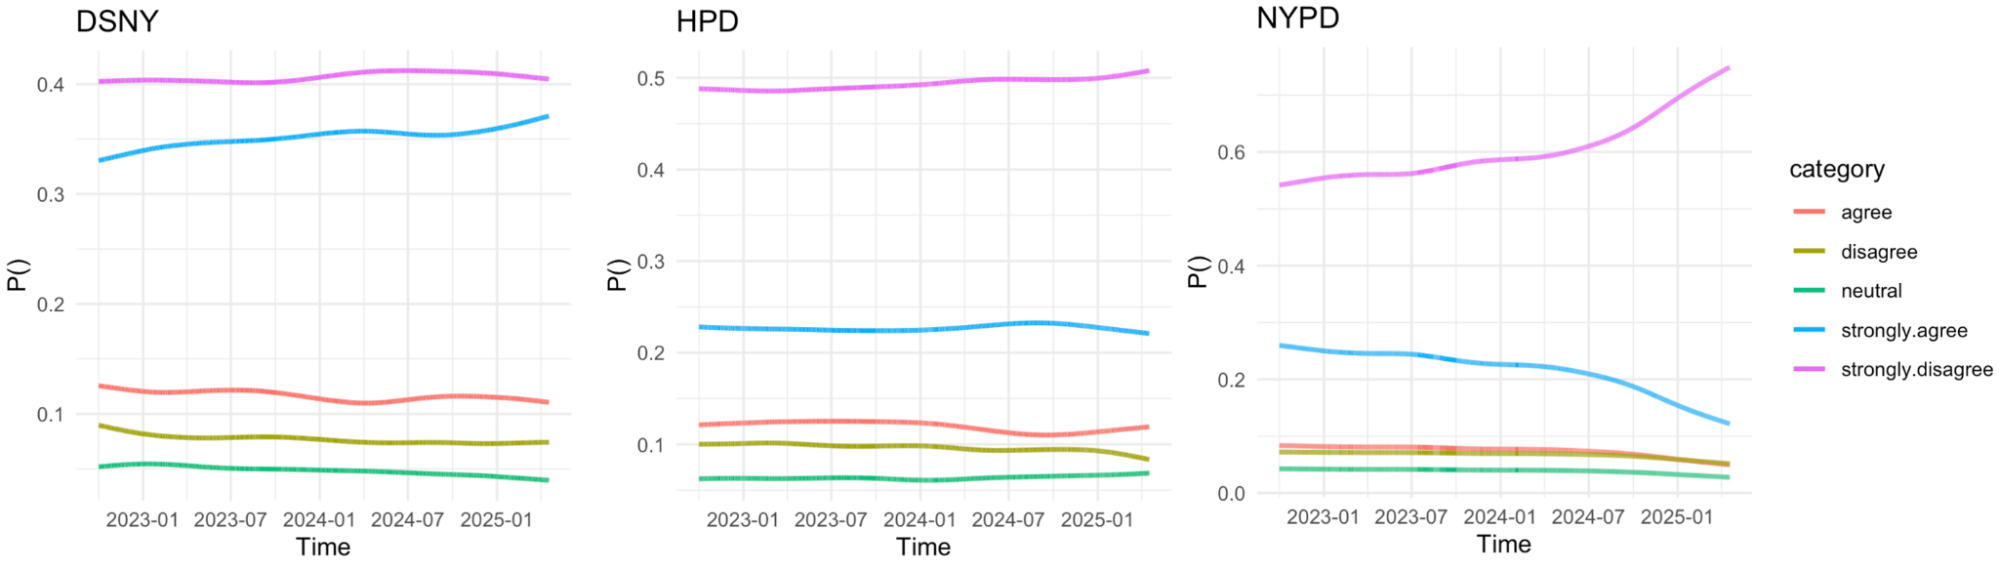
Figure 1. Satisfaction distribution shifts over time
Key Insights on Customer Experience
The customers were asked to rate their satisfaction with completed service requests from 0 to 100, in increments of 25, where 0 represents ‘Overall, I am highly dissatisfied with the way my service request was handled’ (Strongly Disagree) and 100 represents ‘I am highly satisfied’ (Strongly Agree). Figure 1 shows how these satisfaction scores shifted over time.
Growing satisfaction with Sanitation services.
Residents have become increasingly satisfied with DSNY’s performance over time. The shift toward higher satisfaction suggests that ongoing operational improvements— such as better scheduling and quicker responses— are being recognized by the public.Declining satisfaction with Police services.
For NYPD, the opposite trend emerged. Over the past year, dissatisfaction has grown sharply, with more residents reporting that their issues were not properly resolved. This pattern was consistent across precincts and types of service requests. These findings highlight an urgent need for better communication and follow-up mechanisms to rebuild trust between the public and law enforcement.Mixed results for Housing services.
HPD displayed varied trends. While satisfaction generally decreased in other months, the department saw better feedback in the summer months suggesting that targeted improvements can meaningfully shift public perception.
What Drives Dissatisfaction
Residents who expressed dissatisfaction were asked to identify their main reason. Figure 2 displays the response categories and how each category changed over time. One recent improvement stands out: the City introduced a new feedback category “The Agency did not correct the issue and this Service Request should be reopened.”, allowing residents to request that a “closed” case be reopened if the issue wasn’t truly resolved. Since its introduction, more customers have chosen this option instead of giving up or leaving vague comments.
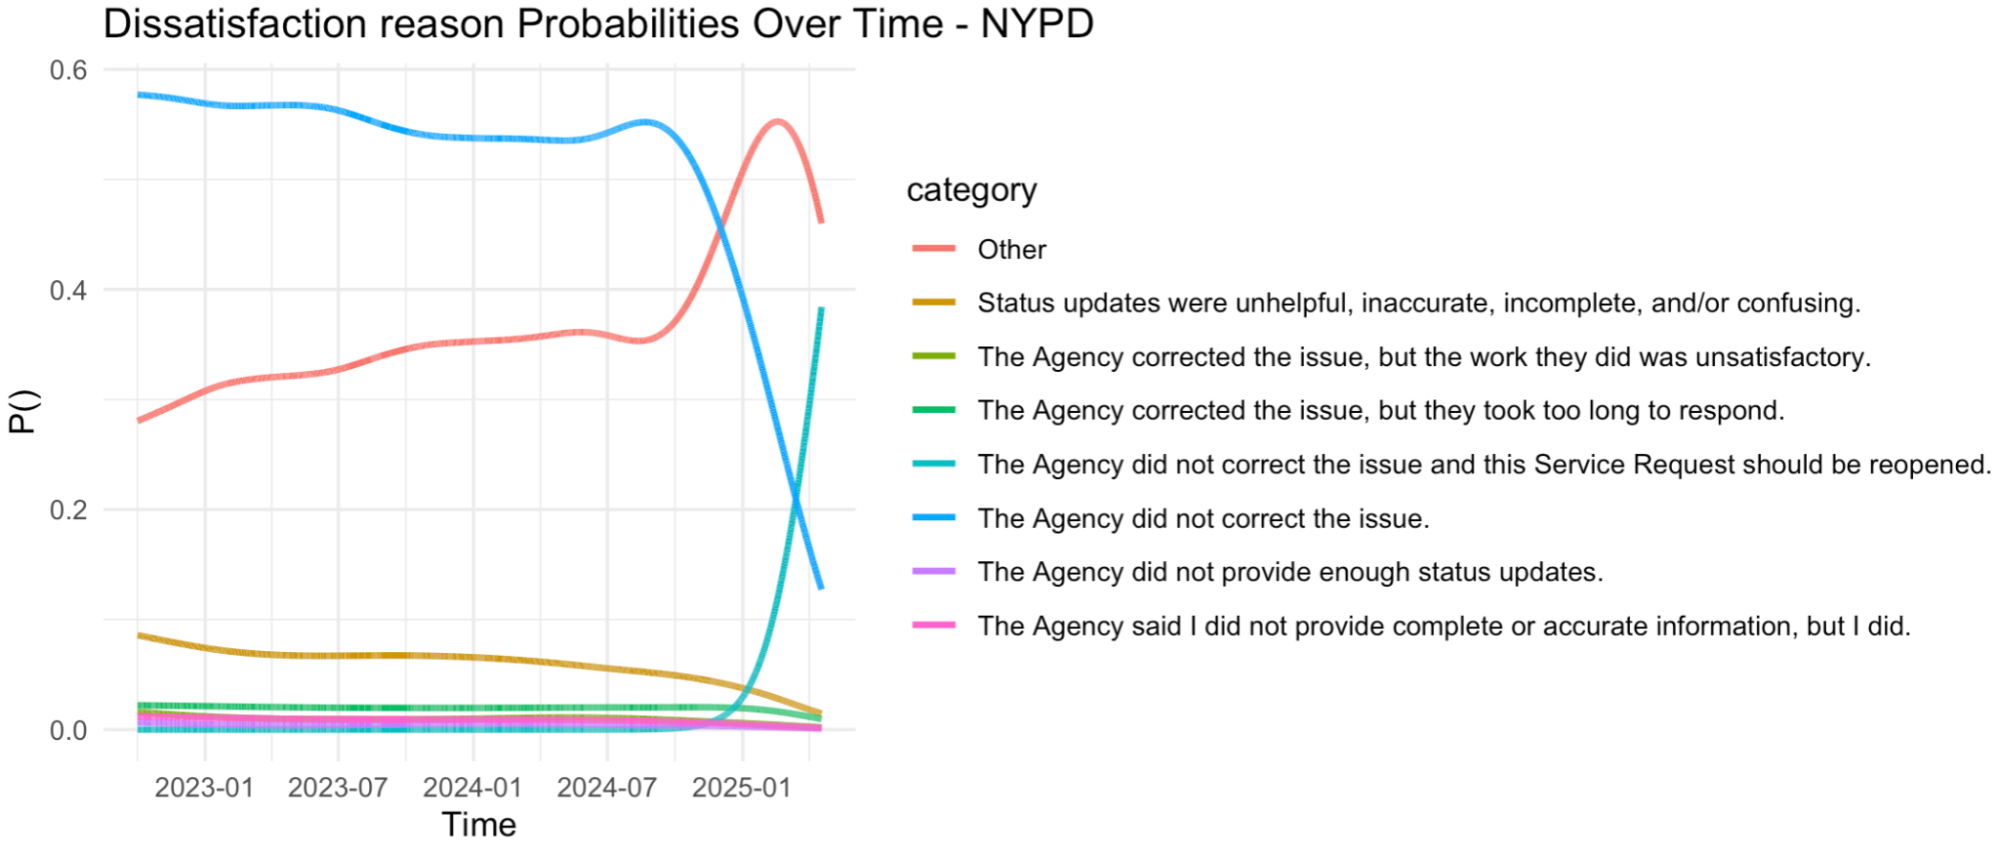
Figure 2. Dissatisfaction reasons distribution shift of NYPD
This change reflects a deeper social impact: people feel more empowered to hold agencies accountable. The City’s willingness to let residents reopen cases is helping transform frustration into constructive engagement.
Beyond examining dissatisfaction reasons, we found a relationship between satisfaction scores and service resolution times. For example, NYPD service requests that were closed “immediately” (within an hour) often resulted in low satisfaction, suggesting residents may feel dismissed when their concerns are closed too quickly. Similarly, repeat service requesters— especially on recurring issues like illegal parking—showed the highest dissatisfaction levels, pointing to a need for better long-term solutions rather than short-term fixes.
Impact and Path Forward

Sanghee Kim
Ph.D. Student, Statistics and Data Science, Cornell University
Behind every data point is a person who interacted with their city— whether to report a missed trash pickup, a housing concern, or a neighborhood issue. Understanding their experiences through systematic data allows agencies not just to measure performance, but to strengthen trust and accountability. Ultimately, this project shows how thoughtful use of data can bring city government closer to the people it serves— turning statistics into social progress and feedback into real change.
The framework we developed can provide agencies with a standardized, replicable tool for analyzing satisfaction data. This method allows agencies to track progress and respond more quickly to residents’ concerns, providing advice on the types of operational interventions that could lead to improved satisfaction. As a result, the City can create a continuous feedback loop between residents and government. Future work will involve sharing findings with agency partners and developing operational strategies that directly address the root causes of dissatisfaction. When residents see that their feedback is heard and acted upon, they are more likely to engage in civic processes and partner with government in solving community problems.