The Bike Lane Not Taken: Towards Building a Bike Demand Model from Large-Scale GPS E-Bike Data
Written by Gabriel Agostini

Data from the American Community Survey (ACS) suggests that, on a typical 2023 day, there were over 620,000 bike trips in New York City–and at least 120,000 of these were commuting trips. Cycling as an alternative means of transportation reduces the network stress on saturated systems (the number of cars on the road or commuters on buses) and offers connectivity to bridge “last-mile” gaps in public transportation, all while providing short-term health benefits and even improving longevity.
To catalyze these benefits, city planners spend many efforts building a reliable bike network. In New York City, most driveable streets are also bikeable, but designated cycling infrastructure holds a higher standard of attractiveness and safety. Biking up Central Park West or down Columbus Avenue, for example, will likely feel much more pleasant than competing for space making a left turn in Midtown Manhattan. That is because the former are examples of protected bike lanes: sections of the road exclusively designated for micromobility users (bikers being the most represented group, with growing numbers of scooter or cargo bikes). The New York City Department of Transportation’s Bicycles and Micromobility Unit, where I spent my Summer working as a Siegel PiTech PhD Impact Fellow, oversees such cycling infrastructure in the city. They have been responsible for installing more than 1,550 miles of bike lanes across the five boroughs, creating the largest bike network in the United States. In 2024, 29.3 new miles of protected bike lanes were installed.
The Challenge
Benefits aside, these projects are expensive. They cost the city money, time, and political capital. Accounting for all resources, a protected bike lane may cost anywhere from 130 to 530 thousand dollars per mile (multiply these numbers annually by 29.3 if you want an even more striking figure!) and can take many years to build due to required planning, community engagement, and agency approval processes. Resistance also comes from New York City residents who argue bike lanes do not benefit their neighborhoods or compromise pedestrian safety in their parks, in some cases sparking court cases and mayoral involvement. As I learned throughout the summer, a crucial part of the DOT’s work is being able to articulate the impact of a proposed project (why the benefits will outweigh the resources spent and the disruptions caused) with studies, numbers, and community engagement.
Articulating impact in any micromobility setting is a complicated process hindered by a major data gap: we do not know how many people use each bike lane in the city. Household travel surveys and other national commuting estimates such as the ACS may help illuminate origin-and-destination patterns (how many people ride bikes between their homes to their work), but they don’t really give us any information about routes: do commuters take the bike lanes? Do they prefer a protected bike lane over a shorter, unprotected path? And, importantly, how do these preferences change when a new bike lane is installed? Bike counting sensors have been installed by DOT in specific locations, but they can only provide spatially sparse insights. Studies on a sample of projects reveal that bike lanes in New York City result in increased bike volumes, and nationwide results suggest new bike lanes also often lead to a significant increase in bike ridership. Refining these findings and quantifying the actual number of new trips generated by any new bike lane segment could directly inform where the DOT places protected bike lanes and indirectly support its ongoing advocacy for new cycling projects.
The Project
I worked alongside the DOT to build bike demand estimates that leverage large-scale cycling GPS trace data. Specifically, we used data from CitiBike–New York City’s bike rideshare system. The CitiBike program currently (as of September 2025) includes 135 thousand annual members and almost 250 thousand occasional riders. These bikers conducted over 35 million CitiBike trips in 2023. Whereas data on origin and destination for all these trips is publicly available via NYC Open Data, the electric bikes (about 40% of the fleet) have GPS devices that also reveal the path taken by every biker. This summer, I was able to analyze over 18 million e-bike rides taken between May 2022 and October 2023 from this dataset.
Processing the GPS trajectory data was the cornerstone of my project. Each e-bike issues a GPS ping roughly every 8 seconds; whereas these are frequent and paint a good picture of the path taken by the biker, the trips are better studied if represented as routes in the city’s street network. The process of converting timestamped, discrete GPS pings into likely sequences of streets is called map-matching. While there are many map-matching algorithms available, most focus on sparse pings, four-wheeled vehicles, and route inference. We wanted a method that accurately represented bike data on a dense street network, so I developed a new algorithm.
Our map-matching method uses spatial data science techniques with a topological approach. Essentially, we start by attaching every GPS ping to the closest road. We then clean edges that intersect but do not align with the main GPS path, and finally impute streets that complete the trip in case they are short enough. No step in this process was straightforward, and all required communication with the agency. Creating the New York City street network, for example, entailed deciding to prune vehicle-only highways such as the BQE or the Westside Highway. Understanding the needs and the goal of the DOT was essential to build the best map-matching algorithm for the problem at hand.
We evaluated the map-matching algorithm on a sample of 100 trips and found that it performed very well on all of them, and perfectly on at least 95. We also looked at quantitative metrics such as the fraction of trip discontinuities or the inferred bike speed. With this algorithm, I am now equipped to estimate ridership by CitiBike e-bike users on specific routes and evaluate the impact of new projects .

Gabriel Agostini
Ph.D. Student, Information Science, Cornell University
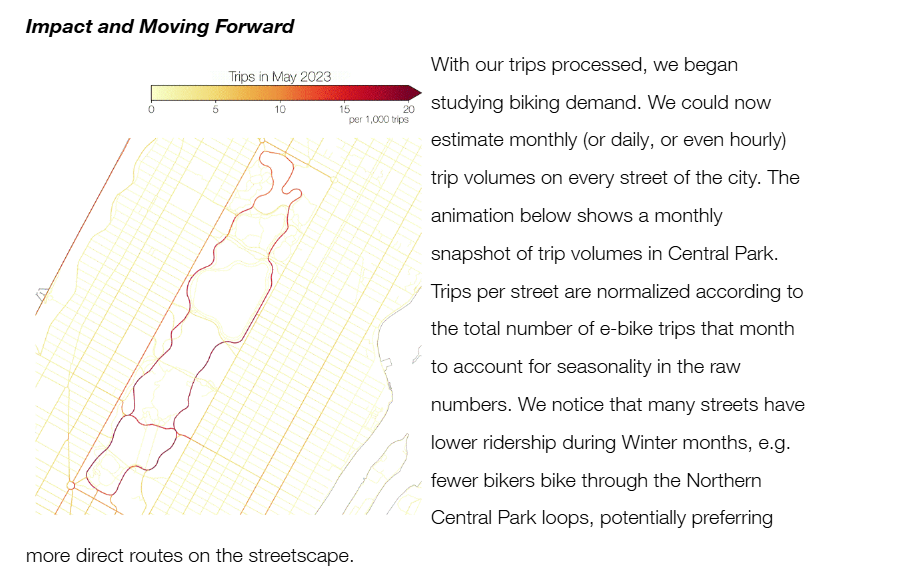
Impact and Path Forward
I am continuing to work with the agency in the Fall 2025, as we think about more ways to use the processed data to estimate the impact of bike infrastructure in the city. For example, we can look at the most traveled streets within a neighborhood lacking a protected bike lane, and investigate whether these are good candidates for a new project. We already found signals that seasonal projects such as Open Streets and Summer Streets can be evaluated with this data. Ultimately, we would like to develop and fit a route choice model to this data: can we use actual trips to estimate the effects of street-level characteristics (e.g. does the street have a protected bike lane, is the street crowded, what is the proximity of the street to a park) on selection of a particular path, especially when such a path is not the shortest or fastest one? How far out of their way do bikers go to travel via protected bike lanes? Do they concentrate in particular lanes–which are then stressed in the network–or do they use all available infrastructure equally? When do bikers, if ever, take the bike lane less traveled by? Knowing that could make all the difference for future infrastructure projects at the DOT.
Acknowledgements
I am very grateful to my supervisors, Carl Sundstrom and Mark Seaman, at the DOT for their support and communication throughout the fellowship. Many people have contributed to the work through feedback, comments, and data: Mojdeh Azad, Andrew Breazeale, Jordan Solano-Reed, and others. Lastly, I am thankful to the entire Bikes Team for being so welcoming and making my experience as a Fellow truly worthwhile.