
Seeing What's Actually on the Shelf: Turning Food Pantry Photos into Data

Written by Anton Derkach
The Challenge
Lemontree runs a platform that connects people to food assistance. Last year it served roughly 1.2 million people across 11 metro areas and helped unlock an estimated $27 million in food and benefits. When somebody needs groceries this week, Lemontree points them to a food pantry.
Until recently, that recommendation rested on logistics. The platform knew a pantry's address, its opening hours, and who was eligible to walk in — everything needed to get a client to the door. What it could not yet describe was what they would find once they were inside: whether this pantry tends to carry halal meat, or baby formula, or the kind of fresh produce a particular diet calls for. The one food-related field attached to a pantry visit was a single checkbox for “fresh produce” — a genuine start, but one bit of information standing in for an entire shelf, and often left unchecked.
The information did exist, though, in a form nobody could use. After visiting a pantry, clients can leave a review, and many of them attach a photo of what they brought home. By the time I joined the team, more than 19,000 of those photos had piled up. Each one is a picture of exactly what a specific pantry handed out on a specific day. Not one of them had ever been read by anything.
As a Siegel PiTech PhD Impact Fellow, I spent the summer building the computer vision system that reads them. I was the only machine learning engineer on it, working directly with Lemontree's Chief of Staff.
Lemontree was clear from the start about why they wanted this, and those reasons shaped every technical decision that followed:
Cultural and religious fit. A client who keeps halal or kosher should be sent to a pantry that actually stocks food they can eat.
Medical and dietary fit. Someone managing diabetes wants more fresh produce and fewer high-glycemic starches — which means the food categories need to be fine-grained enough to filter on.
The economic value of what pantries provide. Food pantries and soup kitchens put real money back into families' hands, and nobody could say how much. Estimating that value — from food that only exists as a photograph — makes it something Lemontree can share with food providers, the pantries themselves, health care providers, academic researchers, and economic mobility experts.
Reporting that informs policy and funding. Which pantries receive and distribute what kinds of food, reported to the local governments and stakeholders who make policy and resource-allocation decisions.
A classifier that simply labels pictures would have satisfied none of these. Each goal put a specific demand on the design, and that is the more interesting story.
The Taxonomy and Tag System
The first problem was a design problem, not a modeling one — and not a simple one. Before you can tell a computer to identify food, you have to decide how to structure the vocabulary it will use. The tags that describe what's in a photo split naturally into two different kinds: facet tags — the form an item is in, its unit, and certifications like halal, kosher, organic, and gluten-free — that describe an item without placing it anywhere, and a taxonomy — coarse categories of food branching down into fine-grained ones — that does the placing. Getting that split wrong, or collapsing everything into one flat list, would have made every downstream decision harder. Nothing in the organization defined either one; there was no food taxonomy anywhere to start from.
The most direct way to build one was to have a vision-language model explore a 500-photo sample, spread evenly across four years and rotated across different pantries, and name everything it saw with no menu to choose from — an “open vocabulary” pass. That produced roughly 5,600 individual sightings using close to 3,000 different names, because “eggs,” “egg carton,” “dozen eggs,” and “large eggs” are four ways of writing the same thing.
Collapsing those messy names into a clean list turned out to be one of the hardest engineering problems in the project. Doing it in one pass exceeded the model's capacity and got cut off partway through. Doing it in small batches was worse: each batch invented the same category over again, with no idea a previous batch had already done so. The fix was to split the job in two. One pass looked at all the names at once, but its only job was to create the vocabulary itself — a short list covering every one of the roughly 3,000 names. A second pass then mapped each raw name onto that now-frozen vocabulary. Every name found a home, and nothing fragmented.
Six cleanup passes followed, then a round of human review in a spreadsheet, then sign-off from Lemontree's Chief of Staff. The result is over 440 food categories sitting under nearly 20 top-level food groups, with just over 3,000 name variants mapped into them. The naming wasn't invented from scratch: the group structure was informed by HPNAP, New York State's nutrition-program reporting standard, so that what the pipeline produces can be reported to local governments and stakeholders.
The Classification Pipeline
With a vocabulary in place, the classification pipeline is conceptually simple. A photo goes in. Out comes a structured list: what the food is, what physical form it's in (fresh, canned, frozen, dry-packaged), how many there are, what unit they come in (cans, bags, loaves, pieces), and where each item is in the photo.
That last piece matters more than it sounds. The coordinates exist for the human review process described later on: they let a labeler open a photo, see exactly where the model thinks each item sits, and check its work quickly instead of starting from a blank photo every time.
A fixed list of over 440 categories would go stale the moment a pantry hands out something new. But letting a model add categories on its own leads to duplicates like “canned peaches,” “peaches (canned),” “peach, can” — with no way to tell they all mean the same thing.
So the pipeline is able to propose new categories on its own, and the taxonomy grows as it runs. But nothing proposed becomes official by itself: periodically, a human reviews the newly added categories and approves them before they're permanently added to the list.
Beyond identifying what's in a photo, the pipeline puts a dollar estimate on it: multiplying the count of each item by a price looked up in a table that Lemontree staff maintain and update.
Evaluating the Model
To measure how well the model performs, I curated a 500-photo evaluation set — sampled evenly across pantries and years so the benchmark doesn't skew toward any one period — and built a UI annotation tool that lets volunteer labelers correct the model's answers against it. It's a web application built in Lemontree's own front-end stack, so it could be lifted directly into their platform. A labeler opens a queue of photos and sees the model's answers already filled in as cards; their job is to confirm them, correct them, or add anything the model missed. Figures 1 and 2 show the annotation tool with the model’s classification and markers overlaid on a photo.
To measure how well the model performs, I curated a 500-photo evaluation set — sampled evenly across pantries and years so the benchmark doesn't skew toward any one period — and built a UI annotation tool that lets volunteer labelers correct the model's answers against it. It's a web application built in Lemontree's own front-end stack, so it could be lifted directly into their platform. A labeler opens a queue of photos and sees the model's answers already filled in as cards; their job is to confirm them, correct them, or add anything the model missed. Figures 1 and 2 show the annotation tool with the model’s classification and markers overlaid on a photo.
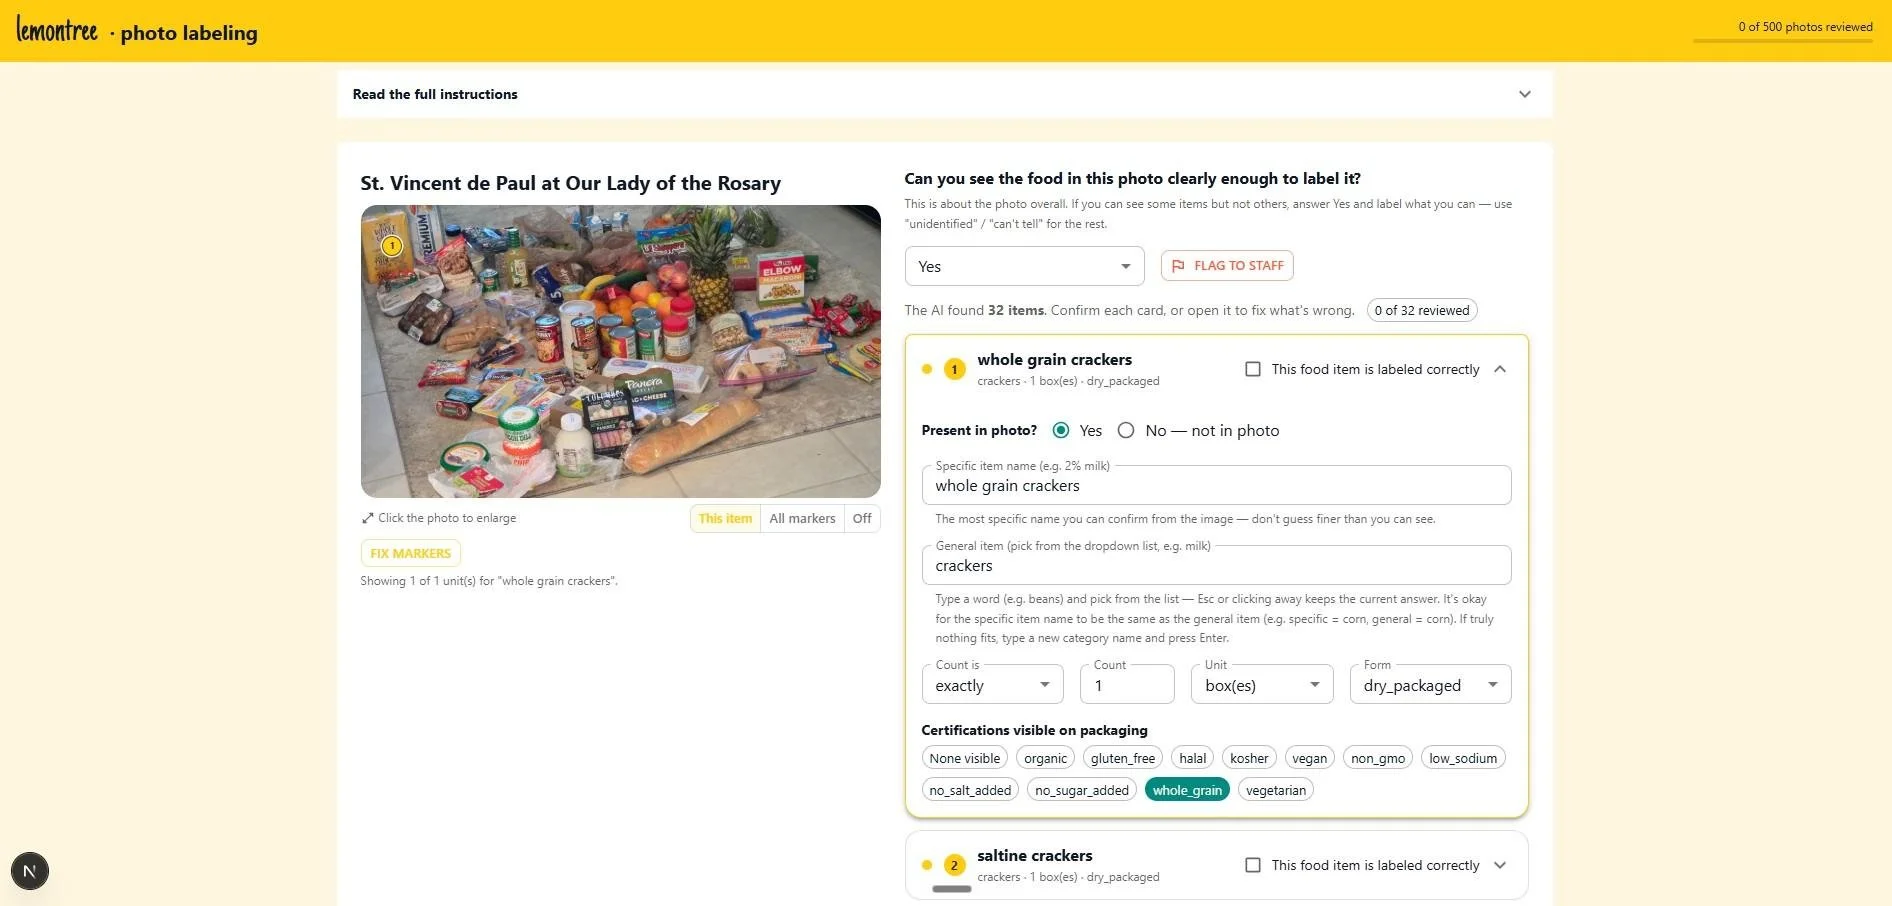
Figure 1
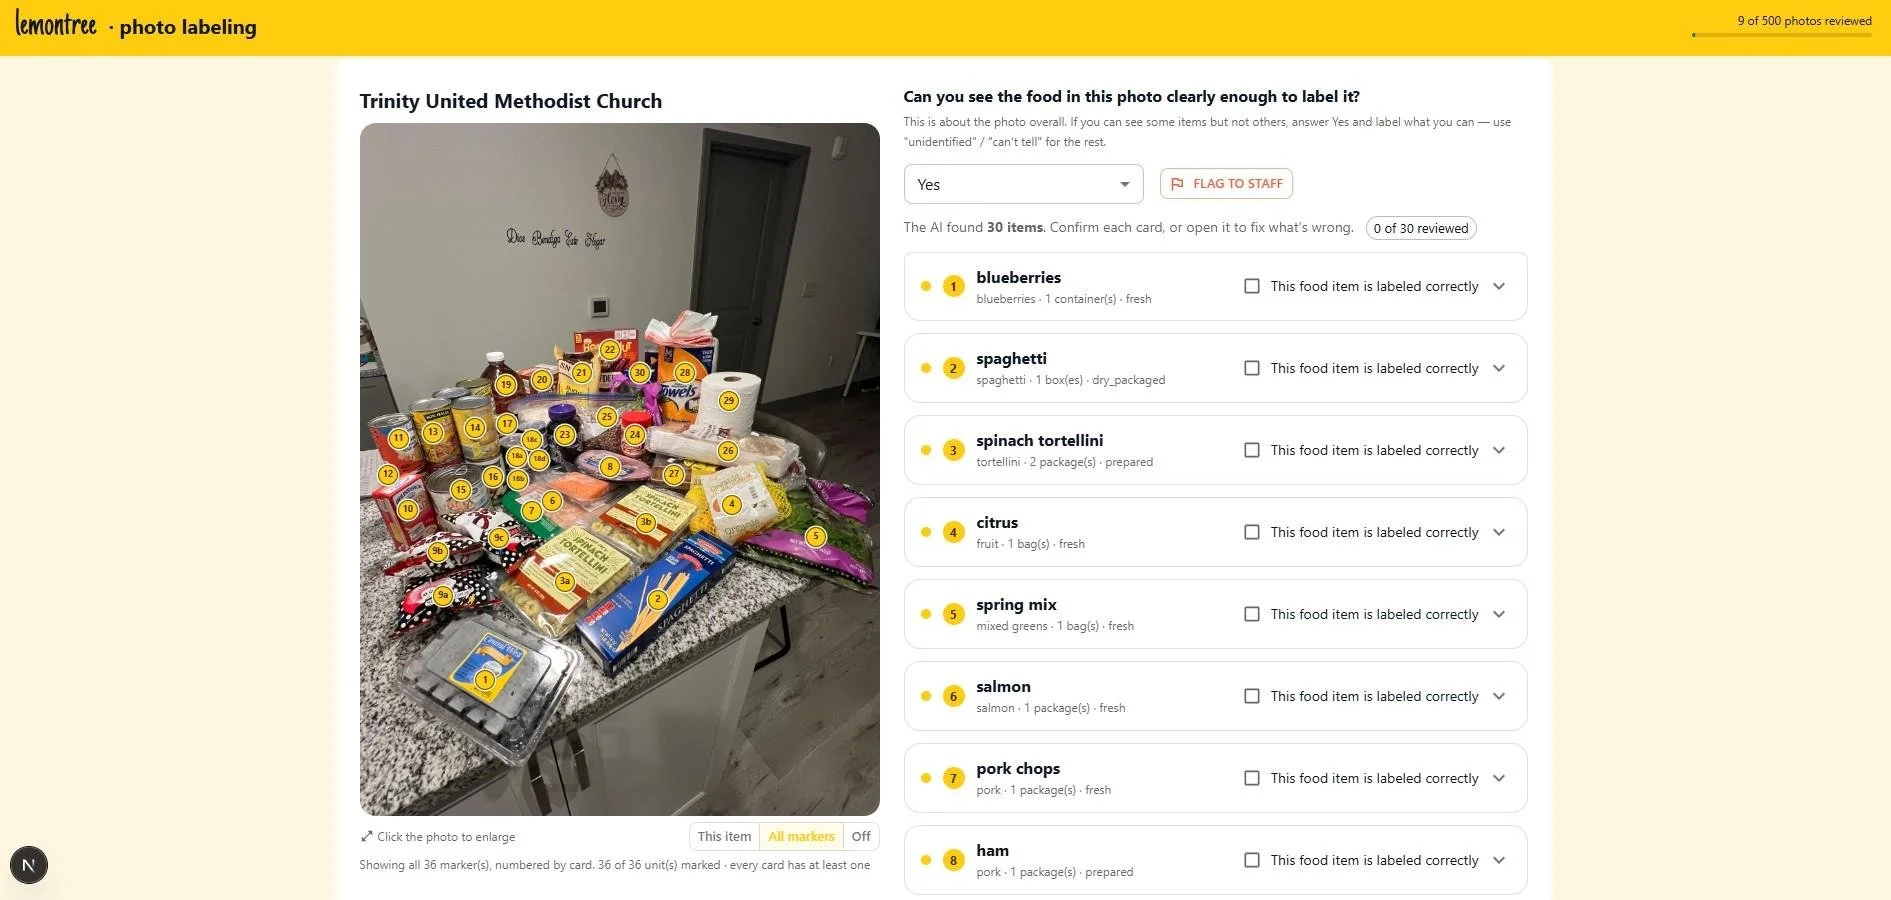
Figure 2
To evaluate the model's accuracy, I wrote a scoring framework covering nine metrics — how often it gets the food category right, whether it identifies the correct unit and form, how close its counts are, and how accurately it locates each item in the photo, among others. Swap in a cheaper or better model next year, and it can be scored against the same answer key without re-labelling a single image.

Anton Derkach
Ph.D. Student, Operations Research and Information Engineering, Cornell University
Impact and Path Forward
What exists at the end of the summer is a complete, documented system: seven pipelines and 31 tools covering everything from pulling photos off the platform and stripping personal information out of them, through building and governing the food vocabulary, classifying photos, measuring accuracy, valuing the food, and measuring what it costs to run. The annotation tool has been integrated into Lemontree's live platform, and the classification data, both data contracts, and a runbook were handed over as a bundle designed to make adoption a mechanical update rather than a redesign.
The machinery is built; what's not yet filled in is the answer key. The next step is the labelling pass — volunteers working through the 500 benchmark photos — which turns the nine specified metrics into nine actual numbers, and finally shows what the vision-language model is capable of on this task. That, in turn, decides whether Lemontree keeps this model in production or switches to a different one; because the answer key is model-independent, that comparison costs a re-run rather than a re-labelling.
Beyond that, the next steps are concrete. The price lookup table needs to be filled in so every category carries a value. The classification output needs to be passed into Lemontree's future recommendation engine, so a client isn't matched to a pantry by hours and location alone, but by what it actually has in stock. And that serves the mission this project was built for from the start: giving clients recommendations that account for their real dietary needs — with the underlying food data available to food providers, health care providers, local governments, academic researchers, and economic mobility experts.