
How do time-of-use rates shape electric vehicle charging profiles?

Written by Lilianna Gittoes
Background
Most residential electricity demand is inflexible. Households use lighting, kitchen appliances, or electric heating when needed, and are unlikely to reduce or shift these uses in response to signals such as higher electricity prices during certain hours. Electric vehicle (EV) charging, on the other hand, is a different story. A typical EV owner might arrive home from work at 6pm, plug in their vehicle, and leave it connected until they leave at 8am the following morning. They are likely indifferent to when the vehicle charges overnight, as long as it is ready for the next day’s travel. With a smart charger, they can easily optimize their charging for hours when electricity prices are lower.
EV adoption is expected to increase substantially in the coming decades, making EV charging an increasingly significant component of residential electricity demand. If many drivers begin charging as soon as they arrive home, they could exacerbate existing demand peaks, increasing grid congestion and requiring more expensive generators to meet demand. To encourage drivers to charge at other times, many utilities offer lower electricity prices during off-peak windows. These time-of-use (TOU) rates typically distinguish between two periods: on-peak hours, when electricity is more expensive, and off-peak hours, when it’s cheaper.
My Project
This summer, I worked with Switchbox as a Siegel PiTech PhD Impact Fellow to understand how TOU rates affect EV charging. My work aimed to answer the following questions:
How does a TOU rate change the amount and timing of residential electricity demand compared with a flat rate, and how does this effect vary as EV adoption increases?
How much can EV owners save on their electricity bills by choosing a TOU rate instead of a flat rate?
Our analysis uses the National Laboratory of the Rockies’ (NLR) 2024 Residential Building Stock model (ResStock) to create a representative sample of households in a chosen geographical region. For each home, ResStock simulates hourly electricity use from appliances, heating, cooling, and other household needs. Because the model does not include EV charging, the first part of my fellowship focused on developing a method to incorporate it.
To model EV charging, we use data from the most recent (2022) National Household Travel Survey (NHTS), which contains travel patterns for light-duty vehicle travel. We assign each ResStock household a travel profile based on its travel characteristics and use that profile to simulate a year of trips. We then calculate the electricity needed to charge the vehicle for those trips under varying EV adoption levels.
Our analysis centers on Maryland. Table 1 compares the two summer rate options available to Baltimore Gas & Electric (BGE) customers: a flat rate and an EV-specific TOU rate. These rates are effective from June 1 through September 30, 2026. They are reported in cents per kilowatt-hour (kWh) and include only electricity supply and transmission costs, collectively referred to as the Standard Offer Service (SOS) rate. Delivery charges are billed separately and do not vary by time of day.
| Daily Rating Period | SOS Rate (cents / kWh) | |
|---|---|---|
| Flat Rate (Schedule R) | All day: 12am - 11:59pm | 14.747 |
| EV TOU Rate (Schedule EV) | On-peak hours: 10am - 8pm on weekdays | 23.636 |
| Off-peak hours: all hours outside the on-peak window | 9.981 |
Table 1: Flat and EV TOU rates offered by BGE (effective June 1 to September 30, 2026)
We assume that each EV remains plugged in whenever it is at home. We compare two charging policies:
Immediate charging: The EV begins charging as soon as it is plugged in and continues at the charger’s maximum power until the battery is full or the vehicle leaves for a trip.
TOU immediate charging: The EV begins charging at the start of the next off-peak period and continues at the charger’s maximum power until the battery is full or the vehicle leaves for a trip. Charging during on-peak hours is allowed only when necessary (assuming perfect foresight) to ensure that the vehicle has enough power to complete its upcoming trips.
Figure 1 (below) illustrates the two charging strategies. Under immediate charging, the EV begins charging as soon as it arrives home and is plugged in. Under TOU immediate charging, the smart charger instead waits until the off-peak period begins at 8pm.
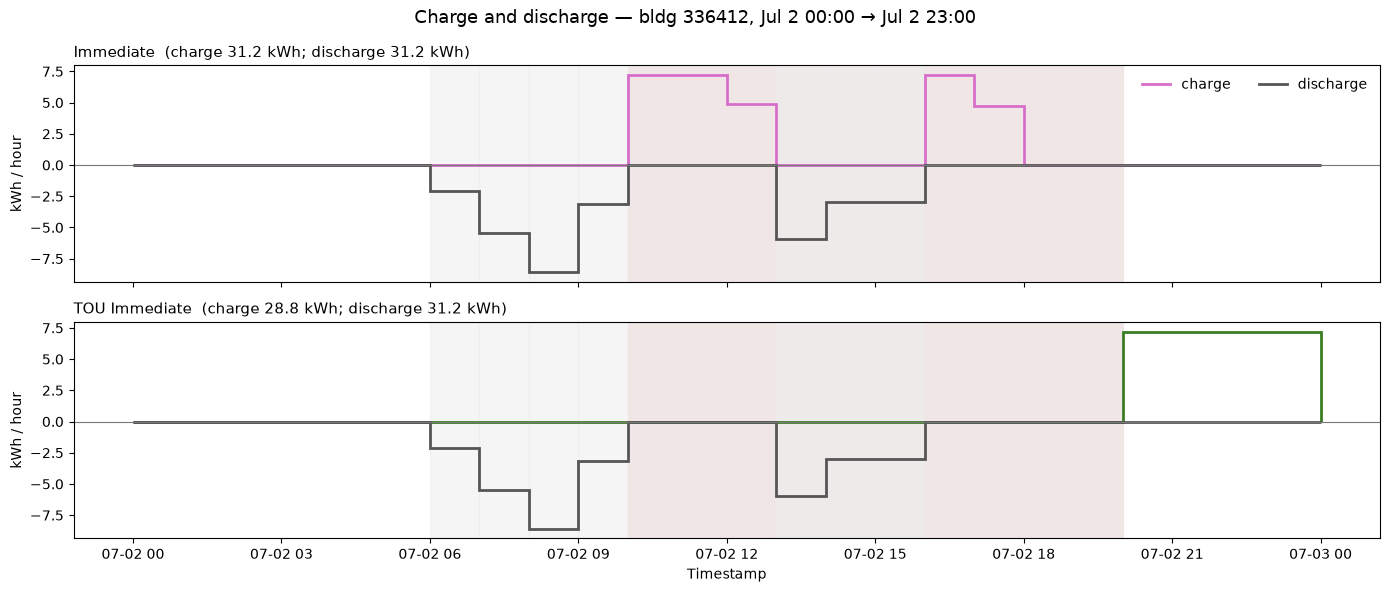
Figure 1: Example EV charging behavior under the immediate and TOU immediate policies
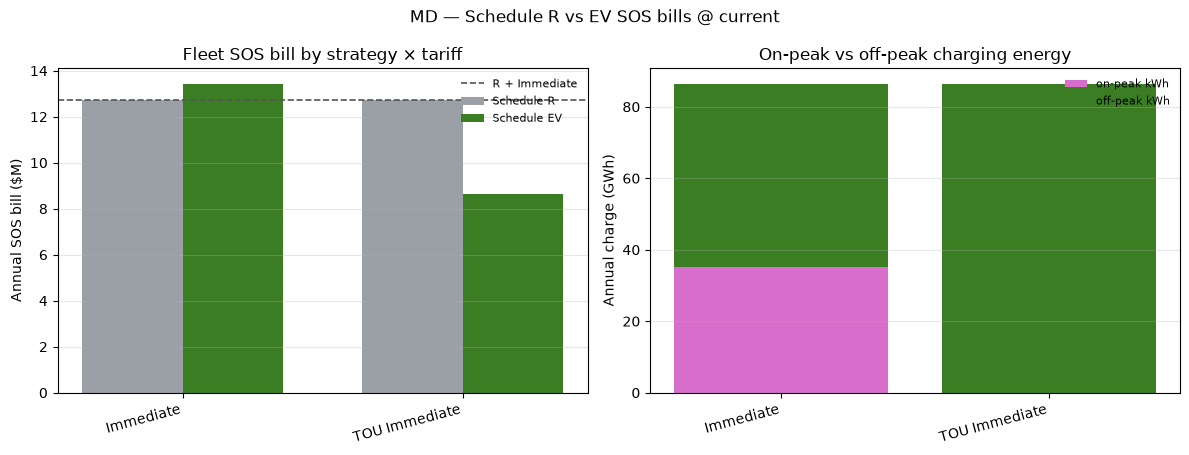
Figure 2: Total annual SOS bills for EV charging and total charging by peak period across Maryland ResStock households
To establish a benchmark for EV adoption, we use adoption rates published as part of NLR’s updated ResStock release in 2025. These rates vary by geographic area, income, building type (e.g., single-family or multifamily dwelling), and tenure (e.g., homeowner or renter). Based on these probabilities, we randomly assign EVs to households in our ResStock sample, yielding an EV adoption rate of 1.84% among occupied Maryland households.
For households assigned an EV, we estimate the savings from shifting charging to off-peak hours under a TOU rate. We use the BGE TOU rate shown in Table 1 and assume that it applies year-round. Figure 3 summarizes the results across all modeled Maryland households with an EV. The left panel shows that, under the TOU immediate charging strategy, these households could collectively save more than $4.4 million per year on EV charging compared with the flat rate.
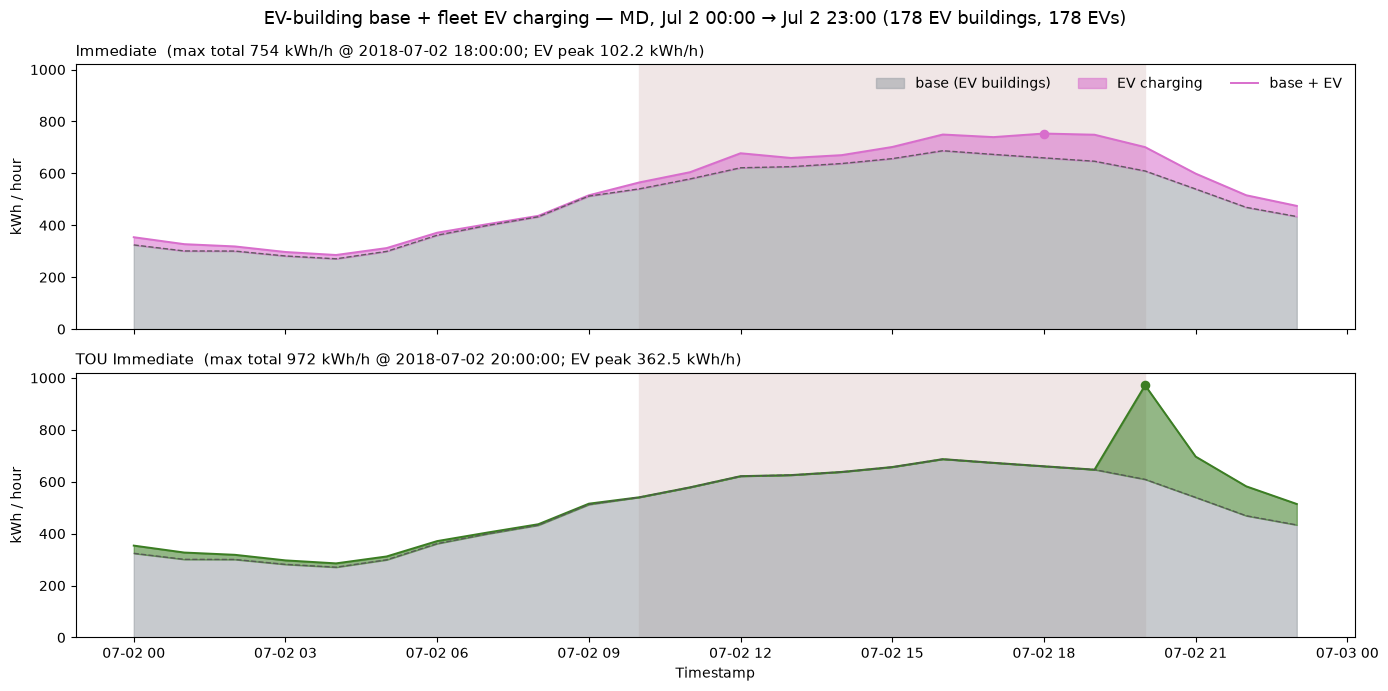
Figure 3: Residential and EV charging demand among all Maryland ResStock households with an EV on a representative summer day
Figure 3 shows combined residential and EV charging demand for households assigned an EV on a representative summer day. Under the TOU immediate charging strategy, EV charging shifts away from hours when residential electricity demand is already high. However, because many EVs begin charging simultaneously when the off-peak period starts at 8pm, the strategy creates a rebound effect: a new maximum demand peak within this segment of the residential sector. When demand is aggregated across all Maryland households, including the much larger number without an EV, this additional peak becomes negligible.
However, as EV adoption increases, these rebound peaks could eventually drive statewide demand peaks. To model this, we scale EV adoption from 0% to 100% in 5% increments and run our EV charging simulation model at each level. Figure 4 shows that, under the TOU immediate charging policy, EV charging begins to drive Maryland’s annual peak demand once adoption exceeds 30%. Under the immediate charging strategy, this does not occur until EV adoption reaches 85%.
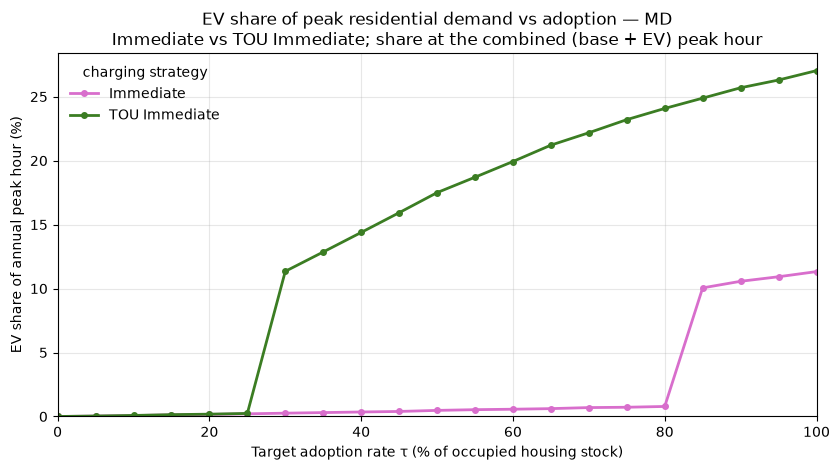
Figure 4: EV share of peak annual total residential demand across all Maryland ResStock households by EV adoption rate
These results reflect the simple charging behavior assumed in our model: under the TOU immediate policy, all EVs begin charging as soon as the off-peak period starts, synchronizing demand and creating a new peak. The model is intended to illustrate the potential for this rebound effect, not to identify the optimal charging schedule. A more sophisticated model could, for example, stagger charging times to reduce peak demand. Utilities could also consider other rate designs that discourage customers from shifting their charging to the same hour, such as peak demand charges.
Overall, TOU rates can lower EV owners’ charging costs while shifting electricity demand away from existing peak hours. However, as EV adoption grows, encouraging all vehicles to begin charging simultaneously could simply replace one demand peak with another. TOU rates are therefore a useful starting point, but their design will become increasingly important as EVs become more widespread. Pairing TOU rates with smarter charging strategies that stagger charging times could preserve customer savings while limiting grid congestion and reducing the risk of new demand peaks.
Reflection / What’s next

Lilianna Gittoes
Ph.D. Student, Operations Research and Information Engineering, Cornell University
Moving forward, the EV charging model I developed will be integrated into SwitchBox’s broader electricity rate design platform, allowing the team to evaluate how different rate structures affect customer costs and electricity demand as EV adoption increases. These insights could also inform SwitchBox’s participation in future utility rate cases, where the organization can advocate for rate designs that benefit both customers and the electricity grid.
One of the most rewarding aspects of my fellowship was seeing how my technical background in electricity systems modeling could be applied to real-world challenges in utility rate design and the clean energy transition. This experience gave me a new appreciation for how mathematical modeling can inform electricity pricing and policy decisions that directly affect customers and the grid. I’m grateful to SwitchBox and PiTech for the opportunity to explore this intersection of technical research and energy policy.