
Explaining Demand and Detecting Local Patterns in NYPD 311 Calls

Written by Ulysse Hennebelle
When New Yorkers use 311 to report noise, illegal parking, blocked driveways, or other neighborhood concerns, each call becomes one small part of a much larger operational picture. Taken together, these records can show how call demand changes across neighborhoods, weeks, seasons, and types of complaints.
As a Siegel PiTech PhD Impact Fellow working with the New York City Police Department, I explored two key questions: Can historical 311 call data be used to explain forecasted service demand? And can it help identify geographic areas with chronically high call volume?
The Challenge
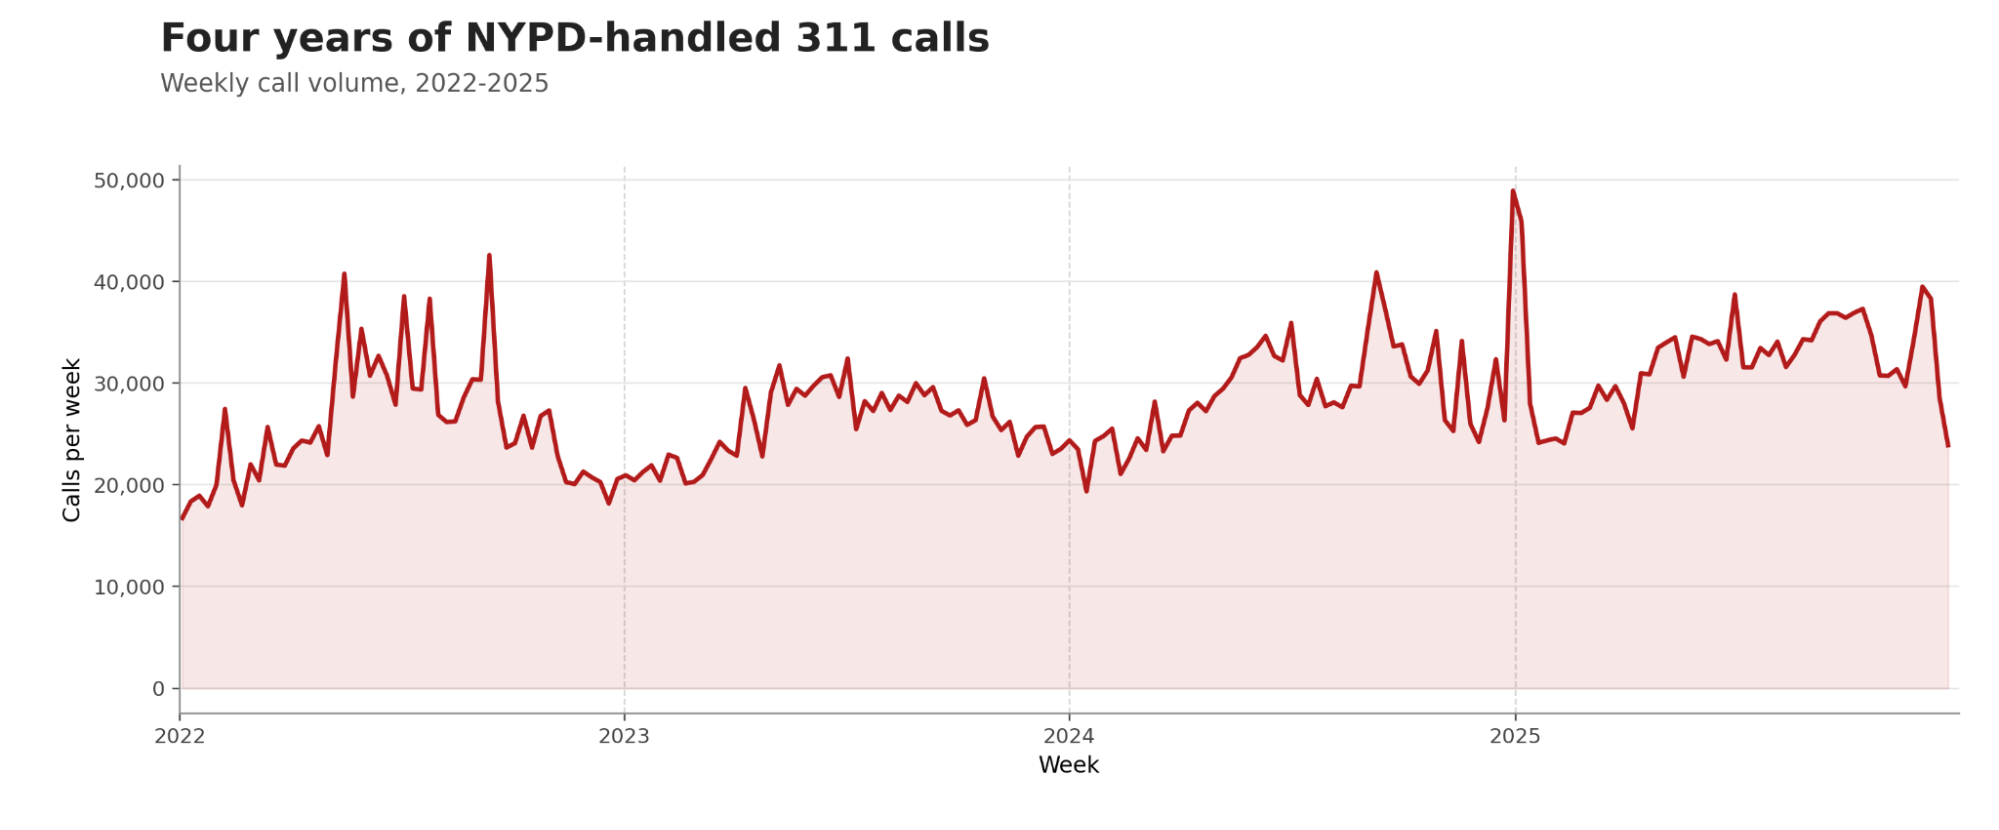
NYC 311 data is public and extensive, but it is not immediately ready for operational analysis. Calls must be aggregated across different time intervals, spatial units, and complaint types. This is important because noise complaints, for example, behave differently from vehicle-related complaints. Weekends, holidays, weather, and seasons can all affect call volumes. A useful model therefore needs to account for these patterns. Finally, fine-grained predictions are more informative but also noisier.
Building a reliable data foundation
A large part of the project involved building the data processing needed to study these questions consistently. The project covers 5.9 million NYPD-handled 311 calls from 2022 to 2025 over 303 police sectors.
I developed a pipeline that uses public 311 records, selects calls handled by the NYPD and aggregates them over various temporal (shift, day, week) and spatial (census block, sector, precinct) units.
The resulting dataset is enriched with external features such as calendar information (holidays, shift-of-day, day-of-week and month of year dummies), weather (temperature, pressure, humidity, wind speed), and census measures (land area, population density, housing units).
Explaining 311 demand
My first objective was to build a prediction model for 311 demand that gets directed to the NYPD based on a simple and interpretable set of features. I compared two approaches: Histogram Gradient Boosting (HGB) and Prophet, a time-series model designed to capture seasonal patterns.
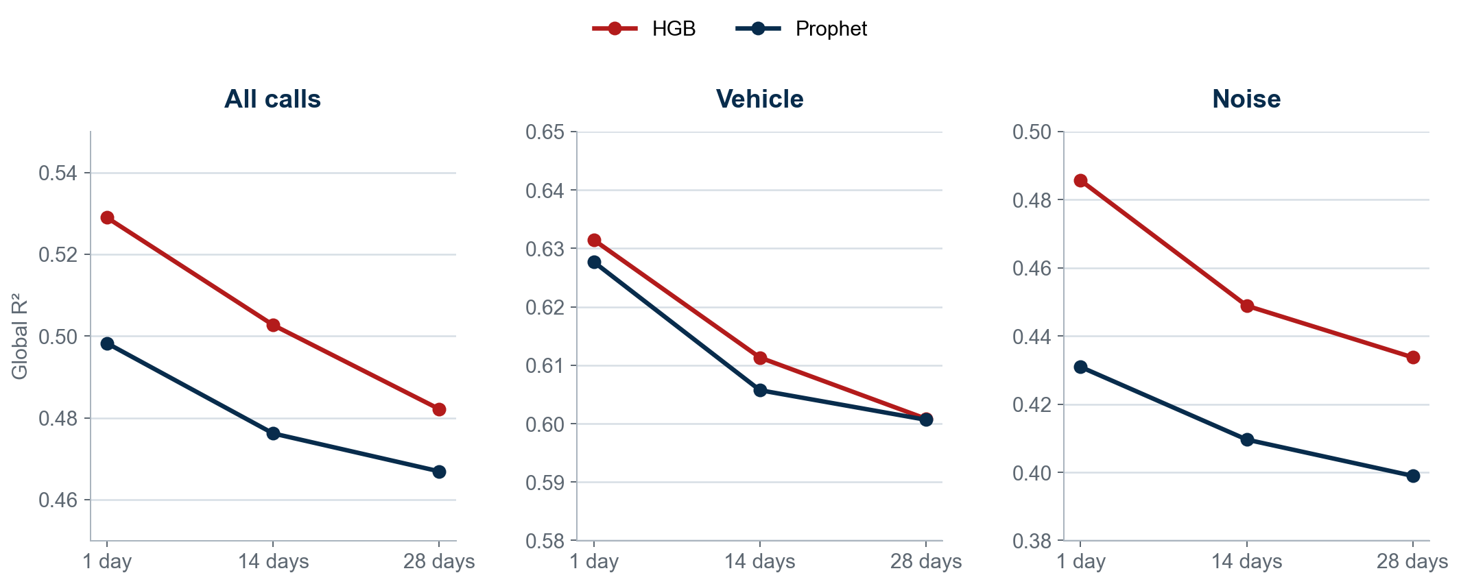
I focused on three target objectives: total call volume, noise complaints, and vehicle-related complaints. I evaluated forecasts at the 1,14, and 28 days horizons over the spatio-temporal police shift by the police sector unit.
HGB generally produced the strongest overall results, improving on the Prophet benchmark on most tasks. All methods performed better at shorter horizons, which is expected. HGB’s advantage is most pronounced on the single day horizon.
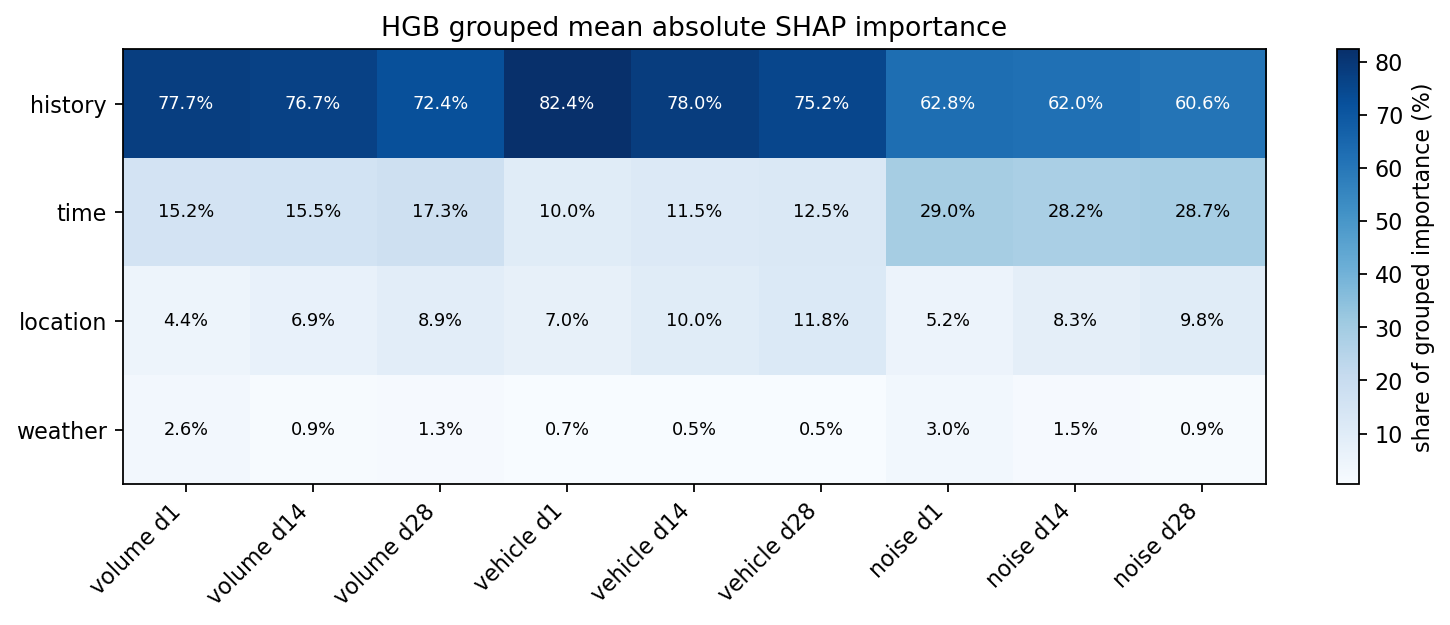
To better understand what was driving the demand, I computed the Shapley values of each family of features for the HGB model. This confirms that additional features improve predictions. In particular, the relative importance of extra features increases at later horizons, where the history becomes less predictive.
Detecting spatial concentrations
Forecasting answers one part of the problem: how much demand should we expect? A second question was: where is activity unusually concentrated?
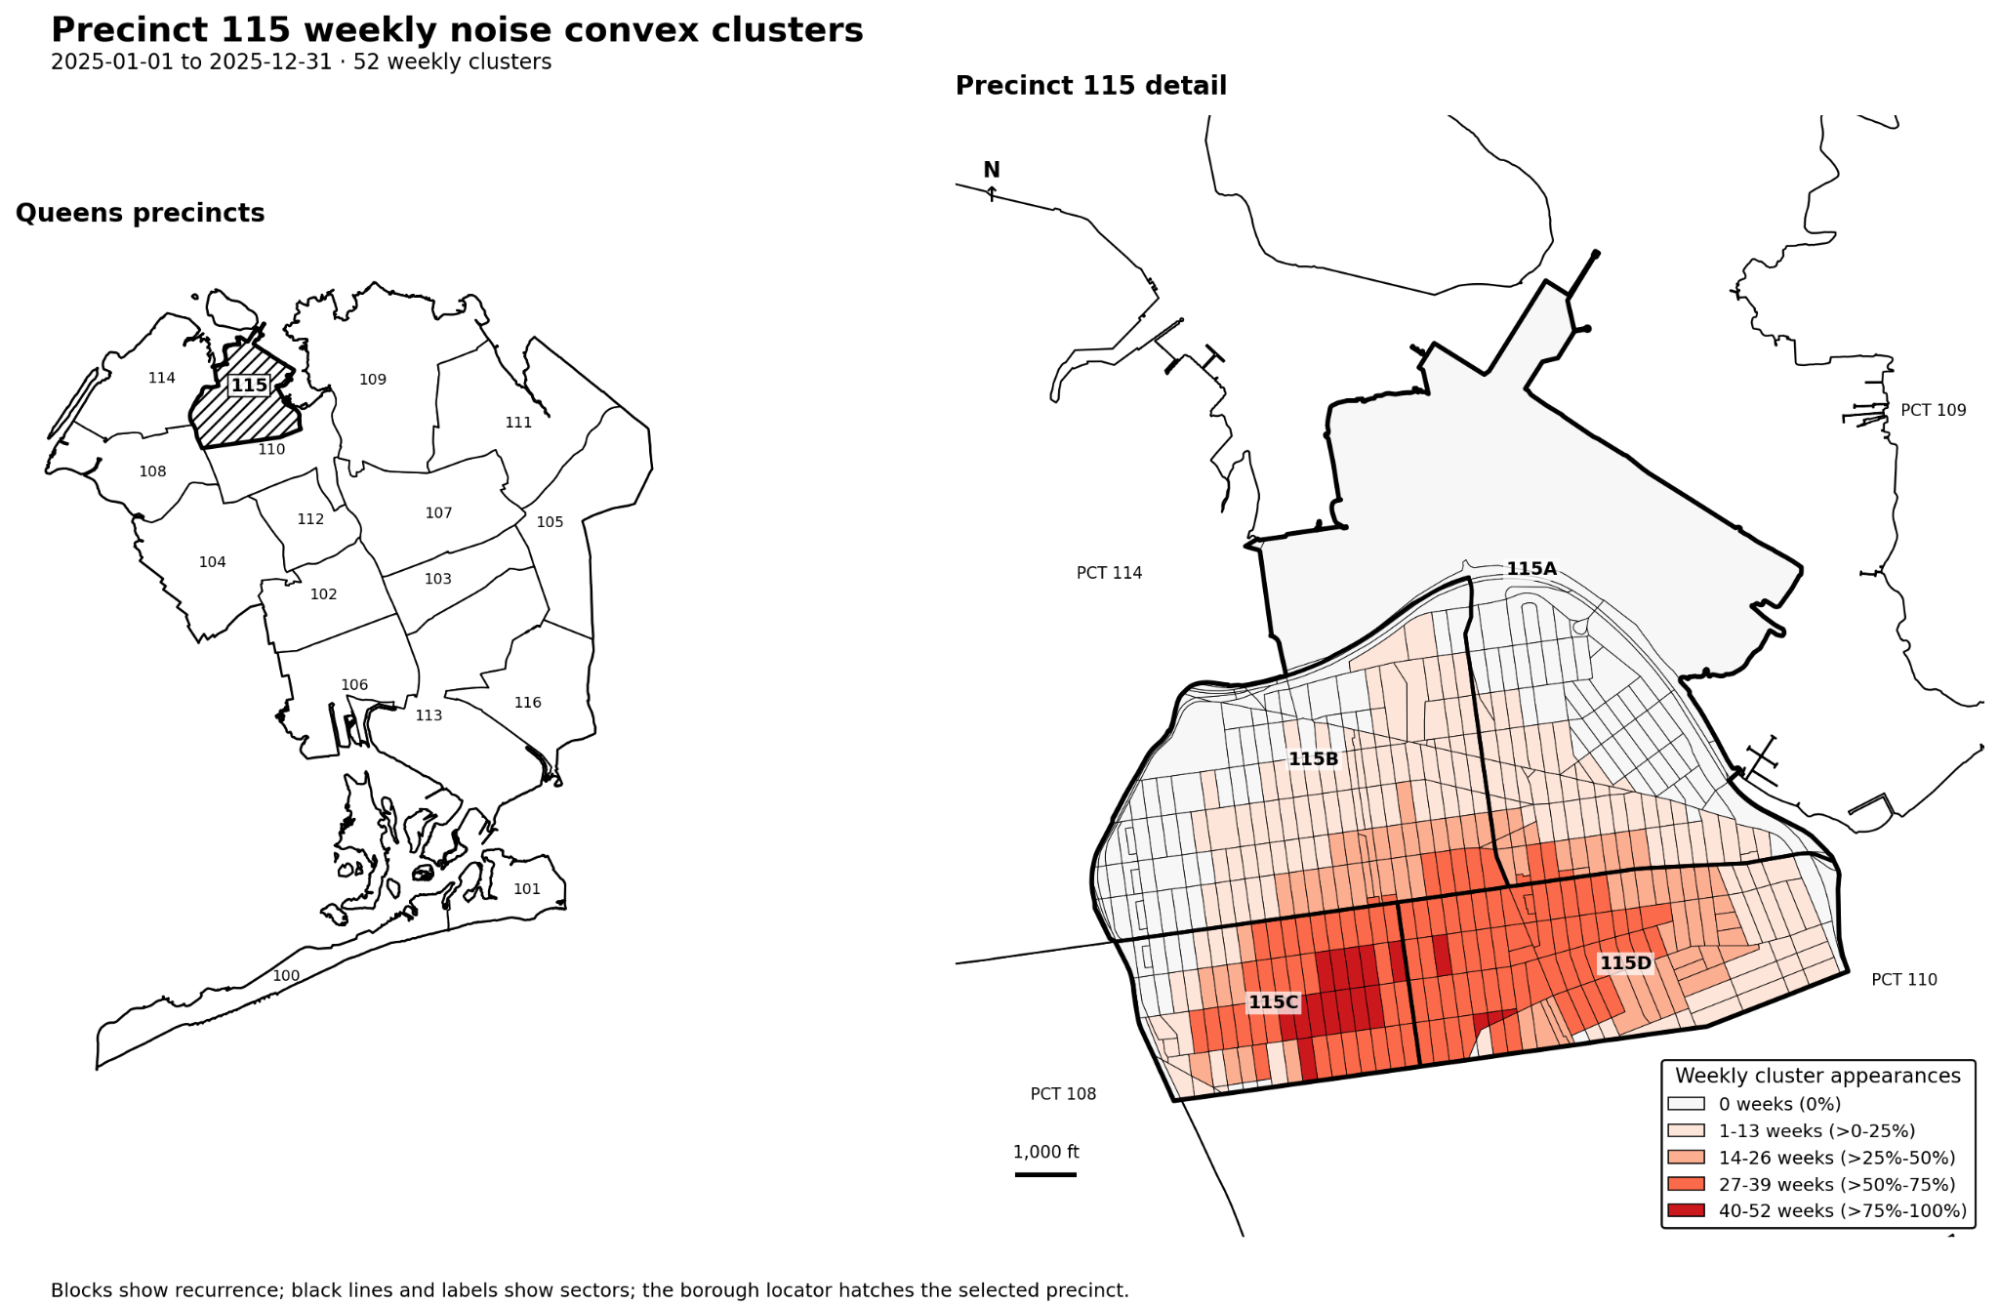
To study this, I implemented the Kulldorff spatial scan statistic. The method finds geographical clusters that have substantially higher call volume over a week. The expected call density was taken to be proportional to the sector’s area; this is a simple and reasonable choice that avoids underestimating demand in low-population, high-activity neighborhoods.
The scan was applied across the city and within individual boroughs when aggregating data by sectors. I then developed a more detailed version that operates inside a precinct by aggregating by census blocks.
The method is traditionally used to detect circular regions; I instead implemented a general convex shapes detection algorithm that gave finer results. This resulted in an improved likelihood ratio in 93% of the cases.

Ulysse Hennebelle
Ph.D. Student, Operations Research and Information Engineering, Cornell University
Impact and next steps
The project resulted in a prototype for temporal and spatial forecast and analysis of the NYPD’s call data. It gives their analysts a consistent way to compare methods under consistent assumptions and to examine both short-term expected demand and long-term chronic locations. It is designed as decision support: the results can help to simplify workflows, direct attention and guide judgment.
Possible next steps that the NYPD is interested in pursuing include:
Transforming the prototype into an operational tool that can assist stakeholders’ decision-making.
Utilizing expectation-based scan statistics with a prior given by the prediction model to connect the two tools in an actionable way directed at anomaly detection.
Applying the pipeline to 911 call data after defining simple call categories.